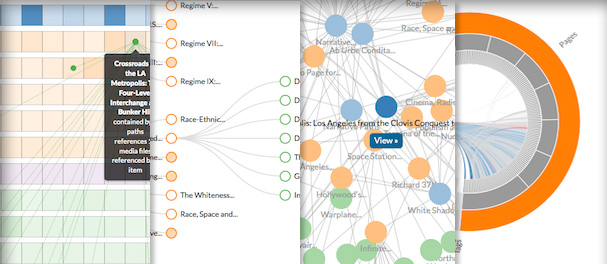
Built-in visualization: more than just pretty pictures.

Scalar lets you structure your publication in ways that would be impossible in print and includes built-in visualizations to help you and your readers navigate those structures. Scalar’s visualizations open the door to digital writing which not only describes ideas, but also viscerally embodies those ideas as well. Want to illustrate a rhizome of connections between a community of authors? Make each author a tag, and then use Scalar’s tag visualization to show how they connect. Visualizations are useful for debugging your work too, enabling you to quickly identify orphan content that hasn’t been linked to anything.
Scalar visualizations come in two varieties: page level and book level. Page level visualizations, which can be used as the default view for any page, generally show only content linked to that page. Book level, or global, visualizations show content across an entire book and allow readers to choose the type of content and relationships they’d like to see visualized as well as the graphical format of the visualization itself.