
Announcing Scalar’s Timeline Layout
Ever wanted to arrange and display pages in your Scalar project along an interactive timeline? Or paths or tags? Ever wanted to showcase a collection of media chronologically? Or a collection of media annotations? Today, we introduce Scalar’s new Timeline layout which will allow you to do all of this and more.
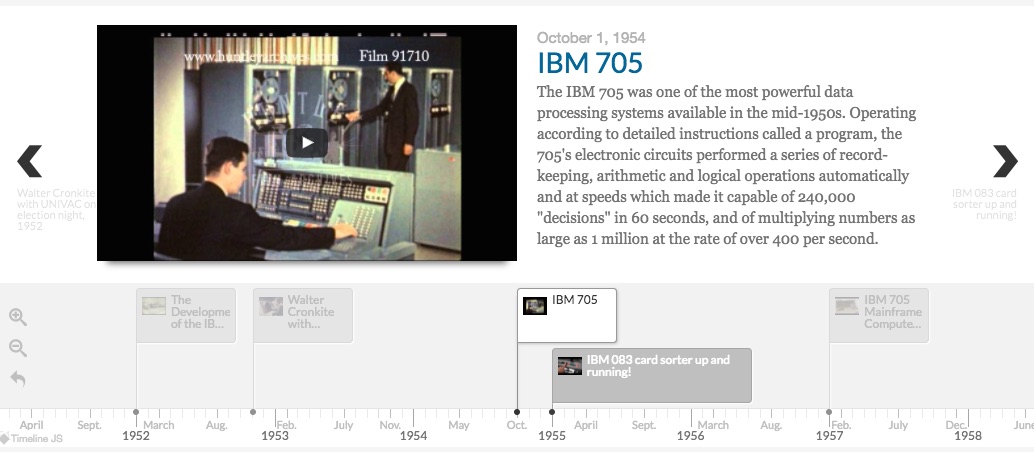
Powered by Knight Lab’s Timeline.JS, this new layout option will display, in chronological order at the top of a page, any content contained or tagged by that page. Each item on the timeline will also display the thumbnail, title, description, and link for its content when clicked. But as with our Google Map layout one must add appropriate metadata to items arranged in the Timeline layout in order for Scalar to plot them appropriately–namely, every piece of content to be displayed must include dcterms:temporal or dcterms:date in the format month, day, year, hour, minute, second.
If that sounds complicated, it’s really not. But just in case, here’s a step-by-step set of instructions for getting going with our own Timeline layout.

Step one: Add metadata to content in your Scalar book. Whether you want to add media, pages, paths, tags or annotations to your timeline, the first thing you need to do is navigate to the edit page for each of the items you’d like to include. Once there, select “Metadata,” in the page editor (see Figure 1), and select “Add additional metadata” from the drop down menu. Then, within the metadata dialogue box that pops up, tick the box next to either “Temporal” or “Date” under “dcterms” and click “Add fields” at the bottom-right of the dialogue box. You should now have a new field under Metadata in the page editor called either “dcterms:temporal” or “dcterms:date,” depending on which you chose. Now enter either a particular date in the form of MM-DD-YY (e.g. 07-21-88) or, if you like, a particular date and time in the form of MM-DD-YY hh:mma (e.g. 07-21-88 2:59 AM) into that field (see here for all supported formats). You can also enter a date (and time) range in the form of MM/DD/YY hh:mma-MM/DD/YY hh:mma (e.g. 07/21/88 2:59 AM-07/22/88 3:31 PM).
Click on graph to enlarge.
Step two: Add descriptions and thumbnails to content in your Scalar book (optional). Our Timeline layout will also display an item’s description and associated thumbnail. To add a description to an item, simply enter your text into the description field just under the page’s title in the page editor. To add a thumbnail click on “Styling” and choose “Thumbnail” from the dropdown menu. Then select an image from your media library or enter a url for the image’s location on the Web.
Click on graph to enlarge.
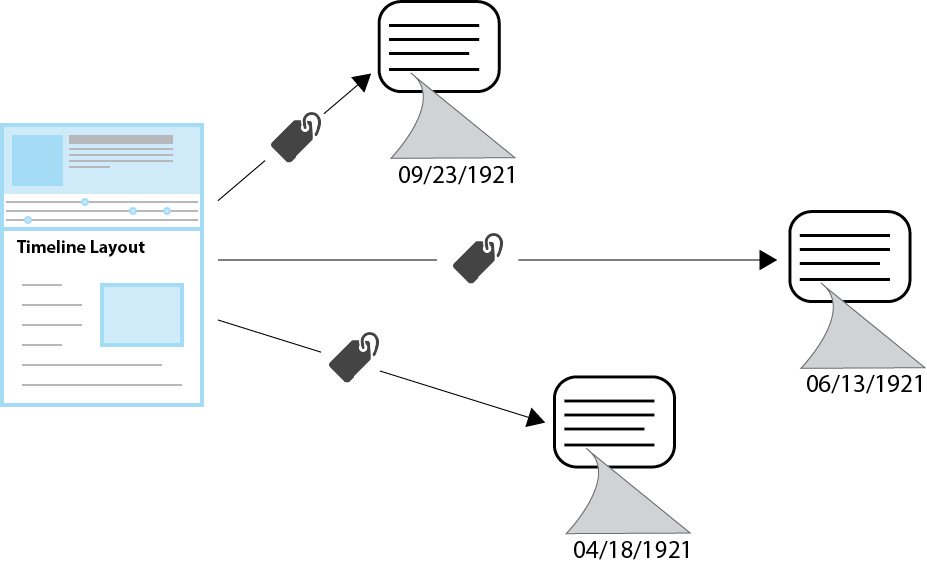
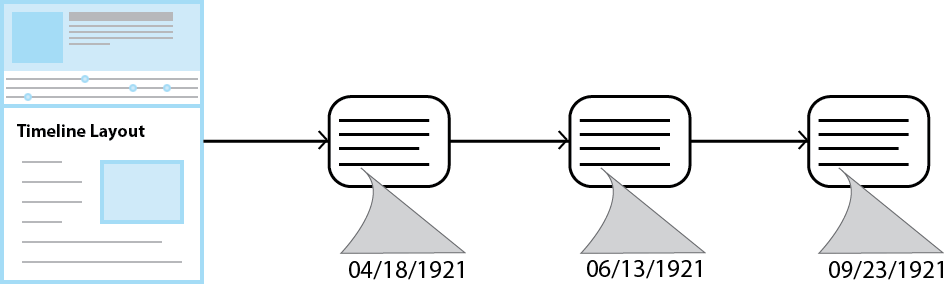
Step three: Gather your content. Once you’ve added temporal metadata to the items you’d like displayed in your timeline, create a new page (or alternatively, use an existing page) and either tag those items to that page (Figure 2) or add them to the page as a path (Figure 3).
Step four: Select the Timeline layout. Finally, set the current page to the Timeline layout via the drop-down menu under “Layout.”
That’s it! You’re done.
We hope you like this new feature, and as always, we’re really excited to see what you all do with it. Let us know what you think, we’d love to hear from you.